
Every radiographic image contains a mixture of useful information (signal) and random variation (noise).
Understanding the origin and behaviour of noise is essential to optimising image quality while minimising radiation dose.
What Is Noise?
Noise refers to random fluctuations in pixel values that do not correspond to real variations in the object being imaged.
It produces a mottled or grainy appearance and can obscure fine detail or low-contrast structures.
A point of confusion may arise when the term noise is used to describe the visual appearance of an image. This is different from the noise (quantitative measure) we use in calculating signal to noise ratio. In this section when we refer to noise we are talking about noise standard deviation.
| Term | Meaning | Usage |
|---|---|---|
| Noise (qualitative) | The visual graininess or randomness seen in an image. | Descriptive, subjective impression. |
| Noise standard deviation (σ) | The measured statistical spread of pixel values around the mean. | Quantitative measure used in SNR and QC testing. |
If you zoom into a uniform region of an image (e.g. soft tissue or an air background), the pixel values won’t all be identical, they fluctuate slightly up and down.
Those random fluctuations are what we call noise.
To express that noise quantitatively, we look at how much the pixel values vary around the mean value for that region.
Let’s say in a uniform area of the image:
- The mean signal (average pixel value) = 1000 (arbitrary units)
- The pixel values vary randomly between about 950 and 1050
The standard deviation (σ) of these pixel values measures the average amount of fluctuation around the mean i.e. the spread of the noise distribution.
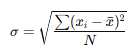
where:
- xi = pixel value,
- xˉ= mean pixel value,
- N = number of pixels in the region of interest. Not to be confused with N (number of photons detected used in the quantum noise formula)
Types of noise in X-ray imaging:
| Type | Origin | Description / Example |
|---|---|---|
| Quantum noise (quantum mottle) | Random arrival of X-ray photons at the detector | Most important source in radiography |
| Electronic noise | Detector readout electronics, amplifiers, analogue-to-digital converters | Constant background noise, more relevant at low exposures |
| Anatomical noise | Overlapping anatomical structures | Limits detectability of subtle pathology |
| Processing noise | Image reconstruction, edge enhancement, post-processing artefacts | Digital “texture” or smoothing effects |
Quantum noise dominates at diagnostic exposures.
Quantum Noise (Quantum Mottle)
X-rays are detected as individual photons, not a continuous stream.
The arrival of photons at the detector follows a Poisson distribution, meaning there are random fluctuations in the number of photons detected per pixel.
If N number of photons are detected:
Noise standard deviation ∝ √N
From this you can see that the noise increases with increasing photon number (N).
You may be wondering, I thought noise decreased with increasing exposure?
And you’re right (kind of).
We rarely talk about noise in isolation. Instead we refer to noise relative to signal. As exposure (or number of photons) increases, noise relative to signal decreases.
So let’s look at noise relative to signal. We call this the signal-to-noise ratio.
Signal-to-Noise Ratio (SNR)
SNR describes how clearly the true image signal can be distinguished from background noise.
It is a key determinant of image visibility and diagnostic quality.
SNR ∝ mean signal / standard deviation of noise
We can replace the mean signal with N (the number of photons detected) and replace standard deviation of noise with √N.
Now:
SNR ∝ N / √N
If we rationalise the denominator, we can see that:
SNR ∝ √N
From this we can see that, SNR increases with the square root of the number of detected photons. Because the number of photons is proportional to dose, we can also say that:
SNR ∝ √dose
You can hopefully see here that improving SNR comes at the expense of dose. This relationship is not-linear!
Doubling dose improves SNR by ~41%, not 100%. Therefore, significant increases in dose are required to make modest improvements in SNR. This reinforces the importance of dose optimisation.
Let’s look at a working example:
| Photon count (N) | Noise (σ = √N) | Relative noise (σ/N) | SNR (= N/√N) |
|---|---|---|---|
| 100 | 10 | 10% | 10 |
| 400 | 20 | 5% | 20 |
| 1600 | 40 | 2.5% | 40 |
Notice how noise increases with increasing photon number but signal increases proportionally. Therefore, the relative noise in the image decreases. We get a “less noisy” image.
So, which factors affect SNR?
| Parameter (increasing) | Effect on SNR | Explanation |
|---|---|---|
| mAs (dose) | ↑ SNR | More photons → reduced relative noise |
| kVp | Mixed | Depends if kVp change is isolated or detector exposure is maintained (mAs compensation) |
| Detector DQE | ↑ SNR | Efficient detectors preserve signal and minimise noise |
| Collimation / filtration | ↑ SNR | Reduces scatter (less background noise) |
| Pixel size | ↑ SNR for larger pixels | More photons collected per pixel |
| Patient thickness | ↓ SNR | More attenuation → fewer photons reach detector |
| Post-processing | Variable | Noise can be smoothed, but at cost of fine detail |
Key Takeaways and Exam Tips:
- Noise = random variation in image signal.
- Quantum noise is the dominant source in radiography.
- SNR ∝ √N ∝ √Dose: doubling dose → 1.4× improvement in SNR.
- SNR can be manipulated by adjusting scan parameters.
- Digital systems can suppress visible noise but not recover lost data.
- Common exam question: “Define SNR and explain how it is related to dose.”
Up Next:
Next, we’ll move on to Spatial Resolution, where we’ll explore what determines an image’s ability to accurately depict fine detail.